Rings in Dove’s Guide and in the sample, by number of bells
| No of Bells | In Total | In Total (%) | In Survey | In Survey (%) |
|---|---|---|---|---|
| 5 | 752 | 14 | 61 | 12 |
| 6 | 2697 | 50 | 249 | 50 |
| 8 | 1678 | 31 | 158 | 32 |
| 10 | 206 | 4 | 23 | 5 |
| 12 | 92 | 2 | 9 | 2 |
Original report pages 4–9.
(Appeared in The Ringing World, 17 February 1989)
The goal of the Survey of Ringing was to get as full and as comprehensive a picture of the state of ringing in the British Isles as possible, within the constraints of the time and resources available. We wanted to know how many ringers there are, how many of the bells are rung, and how often, how good are the relationships between ringers, the clergy and the church in general, what people can ring, what the present situation is with regard to recruitment, what the various ringing Associations and Guilds are doing, and so forth. In brief, we wanted to assess the state of the Exercise, to help the Central Council and its various committees, and the ringing community generally, to plan better for the future.
The best way to get a full picture, of course, is to take a full picture. But there are some 5425 towers with five or more bells in the British Isles according to Ron Dove’s latest Guide and it is commonly believed that there could be anything between 30,000 and 50,000 ringers. To survey them all would have been impossible without a herculean organisation. So we needed to survey a sufficiently large sample from which we could derive an accurate general picture. This did not mean just issuing questionnaires and analysing those that came back, since there would be no way in which we could evaluate whether those who bothered to answer our questions were representative of all towers and ringers.
The theory of sampling provides a basis for conducting an efficient part-survey which is accurate, within defined limits, as long as the basic rules of sampling are adhered to. Those basic rules are very simple, with regard to the two commonest types of sampling. Under random sampling, every member of the population to be studied has to have an equal chance of being selected, and those that are picked have to be chosen randomly so as to maintain those equal chances. Tables of random numbers are available for ensuring that a proper selection is made: they are the equivalent of the bingo caller’s barrel of ping pong balls. Under systematic sampling, the members of the target population are arranged in some order and then every nth person in the list (every fourth, say) is selected. So long as there is no reason to suspect that the ordering procedure biases the selection of the sample towards certain groups and away from others, this is an entirely acceptable way of proceeding.
We wanted two separate samples: 1) a sample of towers, which would enable us to question incumbents and tower captains, and to conduct a census of ringing on a given Sunday; and 2) a sample of ringers. For the sample of towers we selected 500 (for reasons given below), picked at random from all of the towers listed in an updated computer version of Dove’s guide, arranged alphabetically. For the sample of ringers, p. 5 we decided to get lists of ringers at each of those 500 towers from the tower captains, to organise them alphabetically, and then to select every third in the list starting with the second (ie ringers 2,5,8 etc.). Although this ‘discriminates’ slightly against those whose surname begins with ‘A’, we had no reason to believe that such people differ from those with surnames beginning with other letters.
Why take a sample of 500? There are two basic laws in the theory of sampling that are relevant here (they are called the Central Limit Theorem and the Law of Large Numbers). In brief they tell us that the larger the random sample (or a systematic sample that we can assume to be random) the more accurate will be the estimation of the situation in the overall population. It is the absolute size of the sample that is important, not the percentage of the total population surveyed.
How accurate? Let’s assume that we are trying to find out how many towers had their bells rung on the chosen date. We conduct a survey, and we assume that it says 25 per cent were. How sure are we about that figure, given that the sample was a properly taken one? What the theory of sampling tells us is that if our sample was of 100 towers, then we can be virtually certain that the real percentage was somewhere between 16.5 and 33.5; if our sample was of 200 towers, we can be virtually certain that the true value was between 19 and 31; and if we took a sample of 500, the limits would be between 21.2 and 28.8. Clearly, the larger the sample the more accurate the estimate. (You can work this out for yourself by tossing a coin and counting the number of heads and tails; the more times you toss the coin, the closer the percentage of heads is to 50, assuming that you don’t have a weighted coin.) And there is no great benefit in increasing the sample size too far, unless you want to be very accurate indeed; for a sample of 1000, the certainty limits would be 22.3 and 27.7, which would mean doubling the work to ‘tighten’ confidence in the result by only about one per cent at each end of the limit. So with regard to the finding reported above that the bells are rung regularly on Sundays in 62.8 per cent of the towers, we can be virtually certain that the real figure lies between the limits of 58.6 and 67.0 per cent.
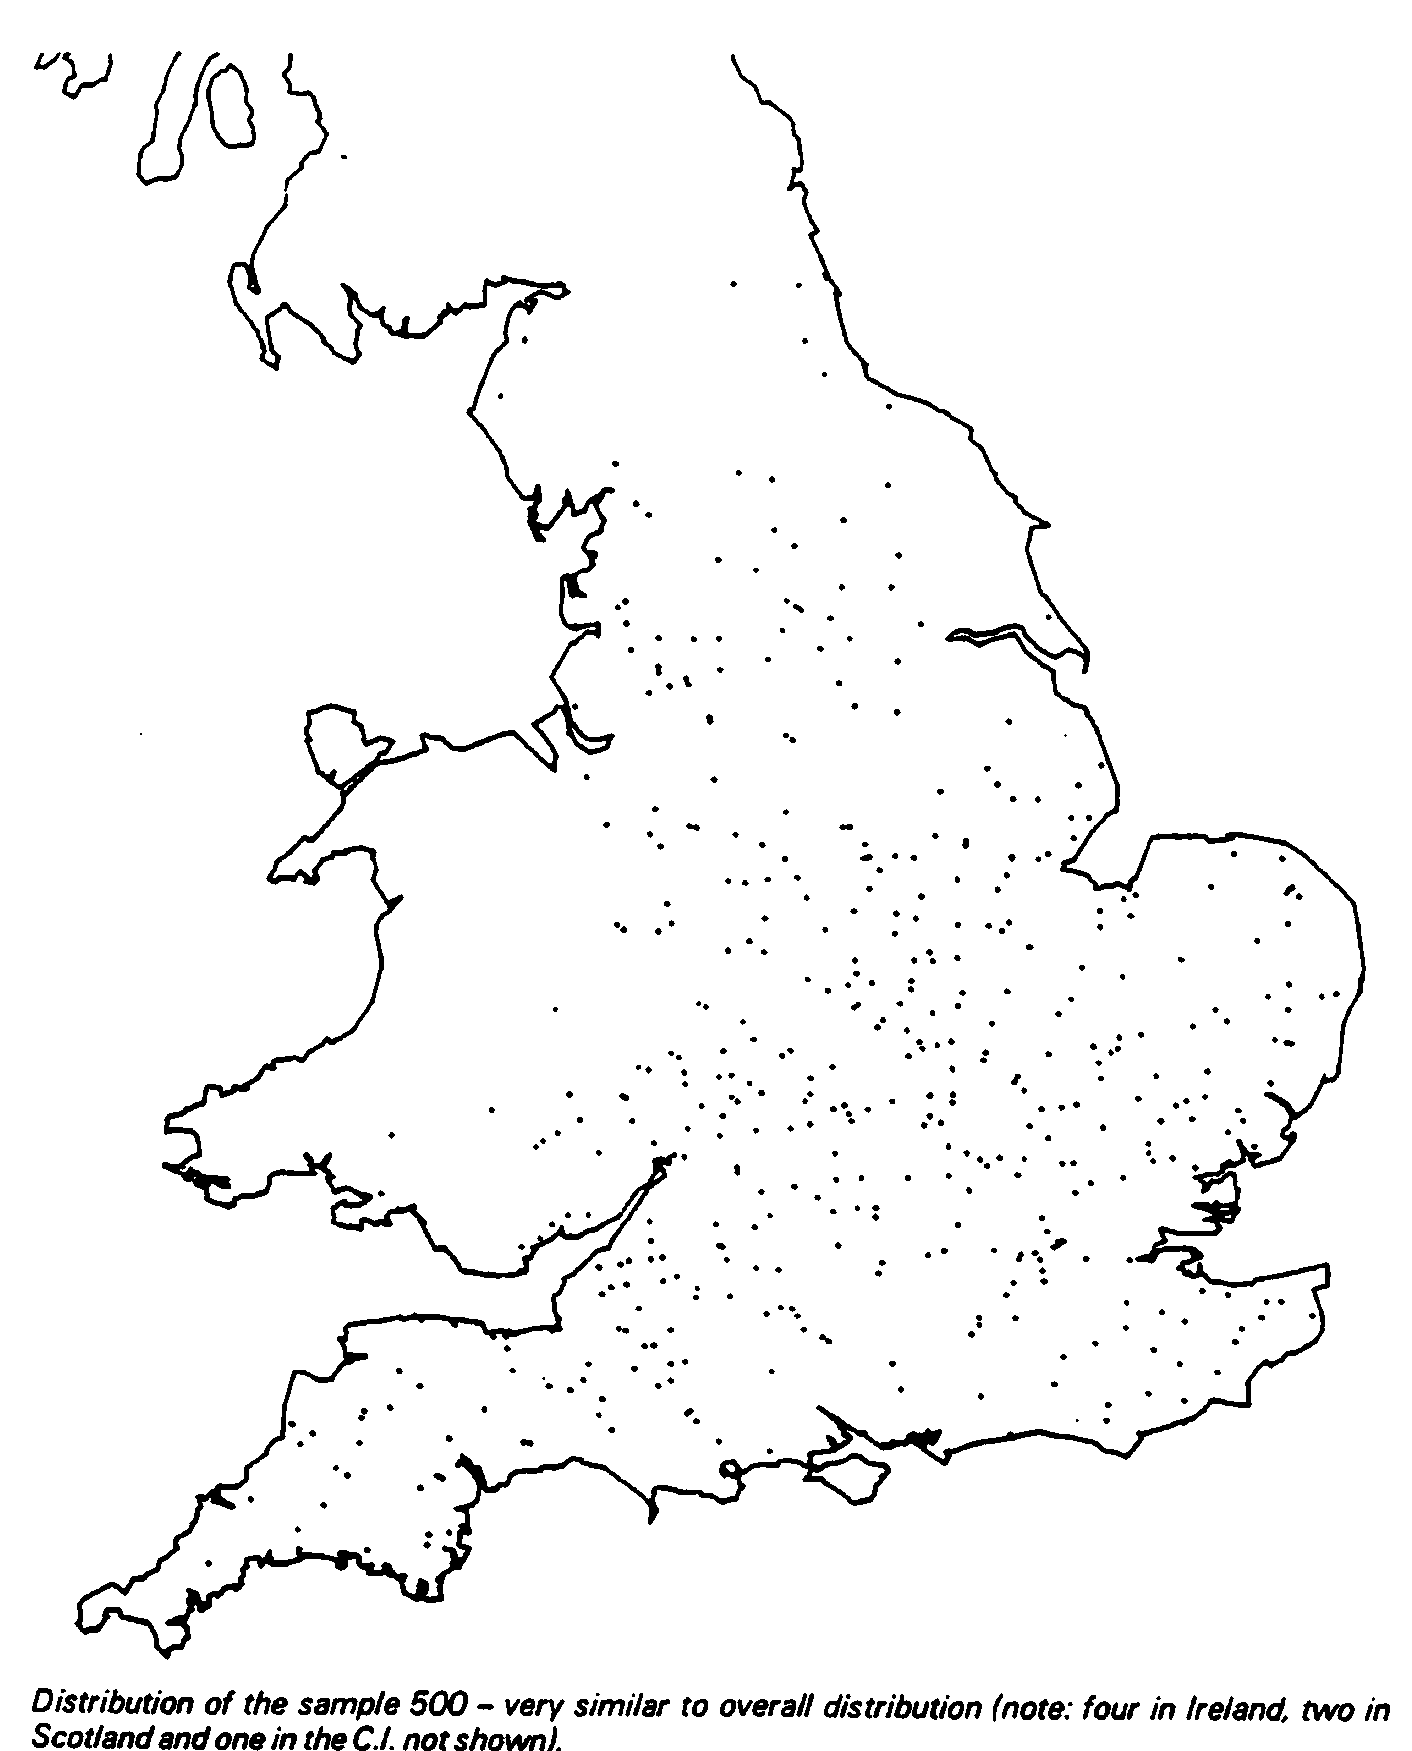
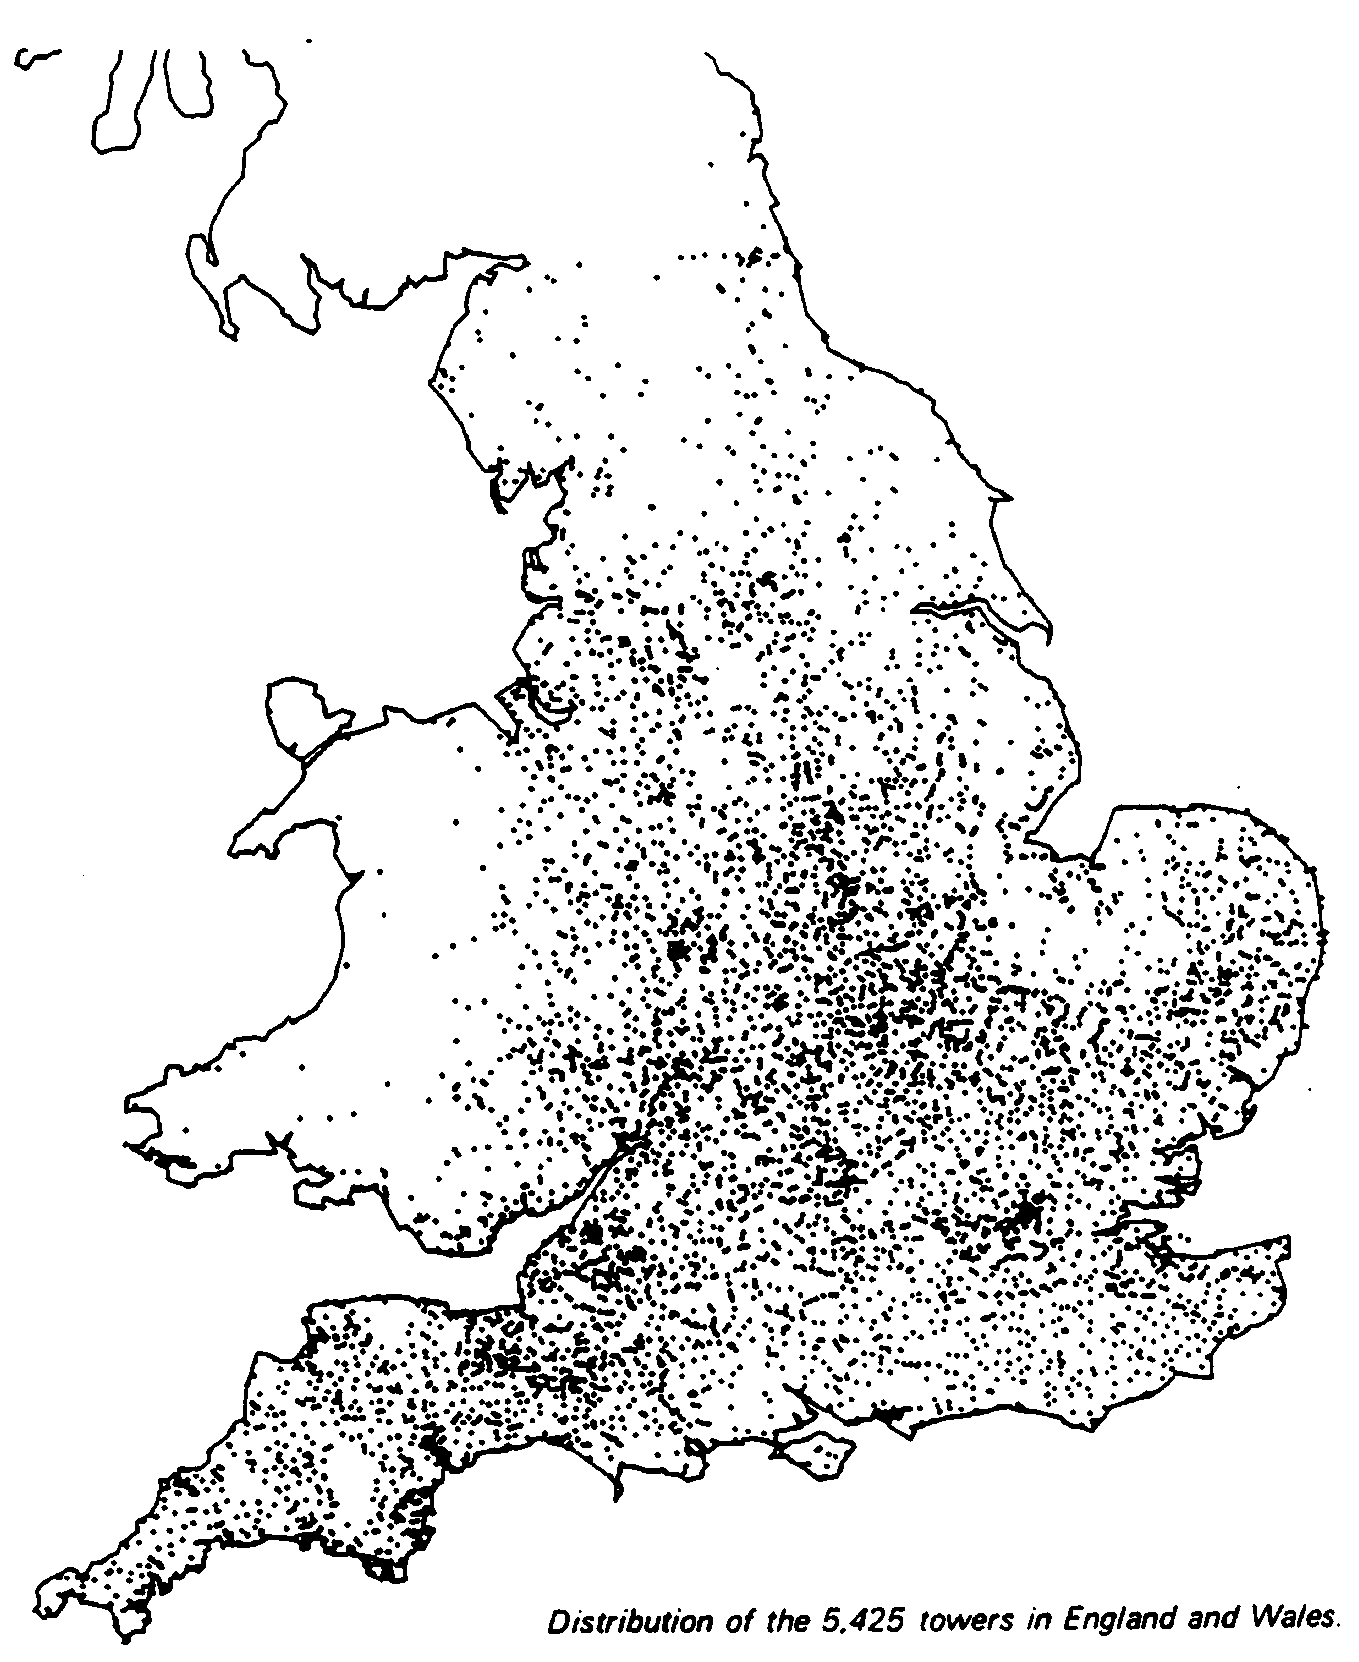
Thus we decided on a sample of 500 towers, taken randomly. How do we know that it is representative? One way is to see if they are all bunched in certain parts of the country. The two maps accompanying this article suggest not; the map of the 500 (Figure 2.1), which excludes the four in Ireland, two in Scotland and one in the Channel Islands, so that individual towers are not identifiable, is very similar to that (Figure 2.2) of all towers in England and Wales. (We can do more precise tests, but won’t report them here.) And we could
p. 6
p. 7
p. 8 see if certain sizes of ring are over- or under-represented. The figures are
Rings in Dove’s Guide and in the sample, by number of bells
| No of Bells | In Total | In Total (%) | In Survey | In Survey (%) |
|---|---|---|---|---|
| 5 | 752 | 14 | 61 | 12 |
| 6 | 2697 | 50 | 249 | 50 |
| 8 | 1678 | 31 | 158 | 32 |
| 10 | 206 | 4 | 23 | 5 |
| 12 | 92 | 2 | 9 | 2 |
(For those who may be wondering, Caistor was counted as an 8, and Basingstoke All Saints as a 10!)
So there is no evidence that we clearly over-represented some groups and under-represented others. Rings of 5 were slightly under-represented, and rings of 8 and 10 very slightly over-represented, but the differences between the two columns of percentages are very small indeed and there is certainly no statistically significant difference between the 5245 towers that make up the entire population and the 500 we sampled. Our sample is representative of towers as a whole.
For the survey of ringers, we decided to take a 1 in 3 sample from each of the 500 towers, excluding tower captains, as they were being surveyed separately. If we were correct in assuming that there are about 40 000 ringers in the British Isles, then our sample of 1 in 30 (1 in 3 ringers in 1 in 10 towers) should have given us about 1300, more than enough to give a very accurate picture of the situation.
By using a sampling procedure, therefore, and giving all those engaged in assisting with the administration of the survey clear instructions on its use, we have obtained sufficient data, at very low cost to the Central Council (though not without a great degree of commitment of voluntary labour by a large number of people), to give us a very accurate picture of the state of ringing in late 1988. (Note that this is the picture as a whole, and not about any one part of the British Isles; we can make useful generalisations about all ringing, and about rings of 6 and 8, but not, for example, about ringing in Wiltshire, where we sampled only 15 towers. The survey could be replicated for particular areas, but our brief was to consider the British Isles as a whole, and our sample size was selected accordingly.)
What sort of response did we get? Very good indeed for the following number of completed questionnaires was received:
Completed questionnaires received from the towers and ringers sampled
| Questionnaire / Basis | Received |
|---|---|
| From INCUMBENTS | |
| maximum possible 500 | 483 |
| From TOWER CAPTAINS | |
| maximum possible 500, if all towers ringable | 300 |
| From INDIVIDUAL RINGERS | |
| 1170 distributed | 1052 |
So what have we discovered? A great deal, and over the next few months we expect to provide you with a stream of articles detailing the results, as well as snippets of interest. We shall, of course, also be informing the Central Council and its committees of the findings, and p. 9 in due course (when we have completed the basic analyses we have set out for ourselves) will be happy to respond and answer ringers’ queries, though of course the data were provided anonymously, and we will not identify individuals or towers.
We have also conducted complete surveys of all territorial ringing Associations and their Branches/Districts, and will be relating the results of those too. The response to those was:
Completed questionnaires received from Associations and Branches
| Questionnaire | Distributed | Received |
|---|---|---|
| TERRITORIAL ASSOCIATIONS WITHOUT BRANCHES | 25 | 22 |
| TERRITORIAL ASSOCIATIONS WITH BRANCHES | 34 | 34 |
| BRANCHES OF TERRITORIAL ASSOCIATIONS | 195 | 187 |