Original report pages 37–45.
(Appeared in The Ringing World, 7 July 1989)
The early reports from the Central Council Survey of Ringing have raised many questions in people’s minds and have produced a number of queries. One of the most common has been ‘Is it like that in our area?’. Because the Survey was designed to provide a picture for the British Isles as a whole, it is impossible to answer that question for any one district; the sample size there will be much too small, and it was agreed from the outset that no information would be published that could be traced to individual towers and ringers. Nevertheless, it is possible to draw some general conclusions about the ‘geography of the state of the ringing Exercise’, and the Survey Committee report on their findings here.
The geographical analyses reported here look at regions and settlement types. We also looked at differences between the metropolitan and non-metropolitan counties, but they were almost all insignificant.
Regions. We use seven - with apologies to those who dislike the ‘new’ counties: Southwest England (Cornwall, Devon, Somerset, Avon, Gloucestershire, Wiltshire, Dorset); Southeast England (Isle of Wight, Hampshire, West and East Sussex, Kent, Surrey, Greater London, Oxfordshire, Berkshire, Bedfordshire, Buckinghamshire, Hertfordshire); West Midlands (Warwickshire, Hereford and Worcester, West Midlands, Shropshire, Staffordshire); East Midlands (Northamptonshire, Leicestershire, Nottinghamshire, Derbyshire, Lincolnshire); East Anglia (Essex, Suffolk, Norfolk, Cambridgeshire); North of England (Cheshire, Merseyside, Greater Manchester, Lancashire, Cumbria, South, West and North Yorkshire, Humberside, Cleveland, Tyne and Wear, Durham, and Northumberland); and Rest of the British Isles (Wales, Scotland, Northern Ireland, Republic of Ireland, Channel Islands).
Settlement Size. We use five categories: Inner City of major conurbations; Suburban; Large City; Town; Village. The categorisation was inevitably somewhat arbitrary in some cases; at a later date we hope to incorporate population size for the villages.
p. 38
Where Do They Ring on Sundays?
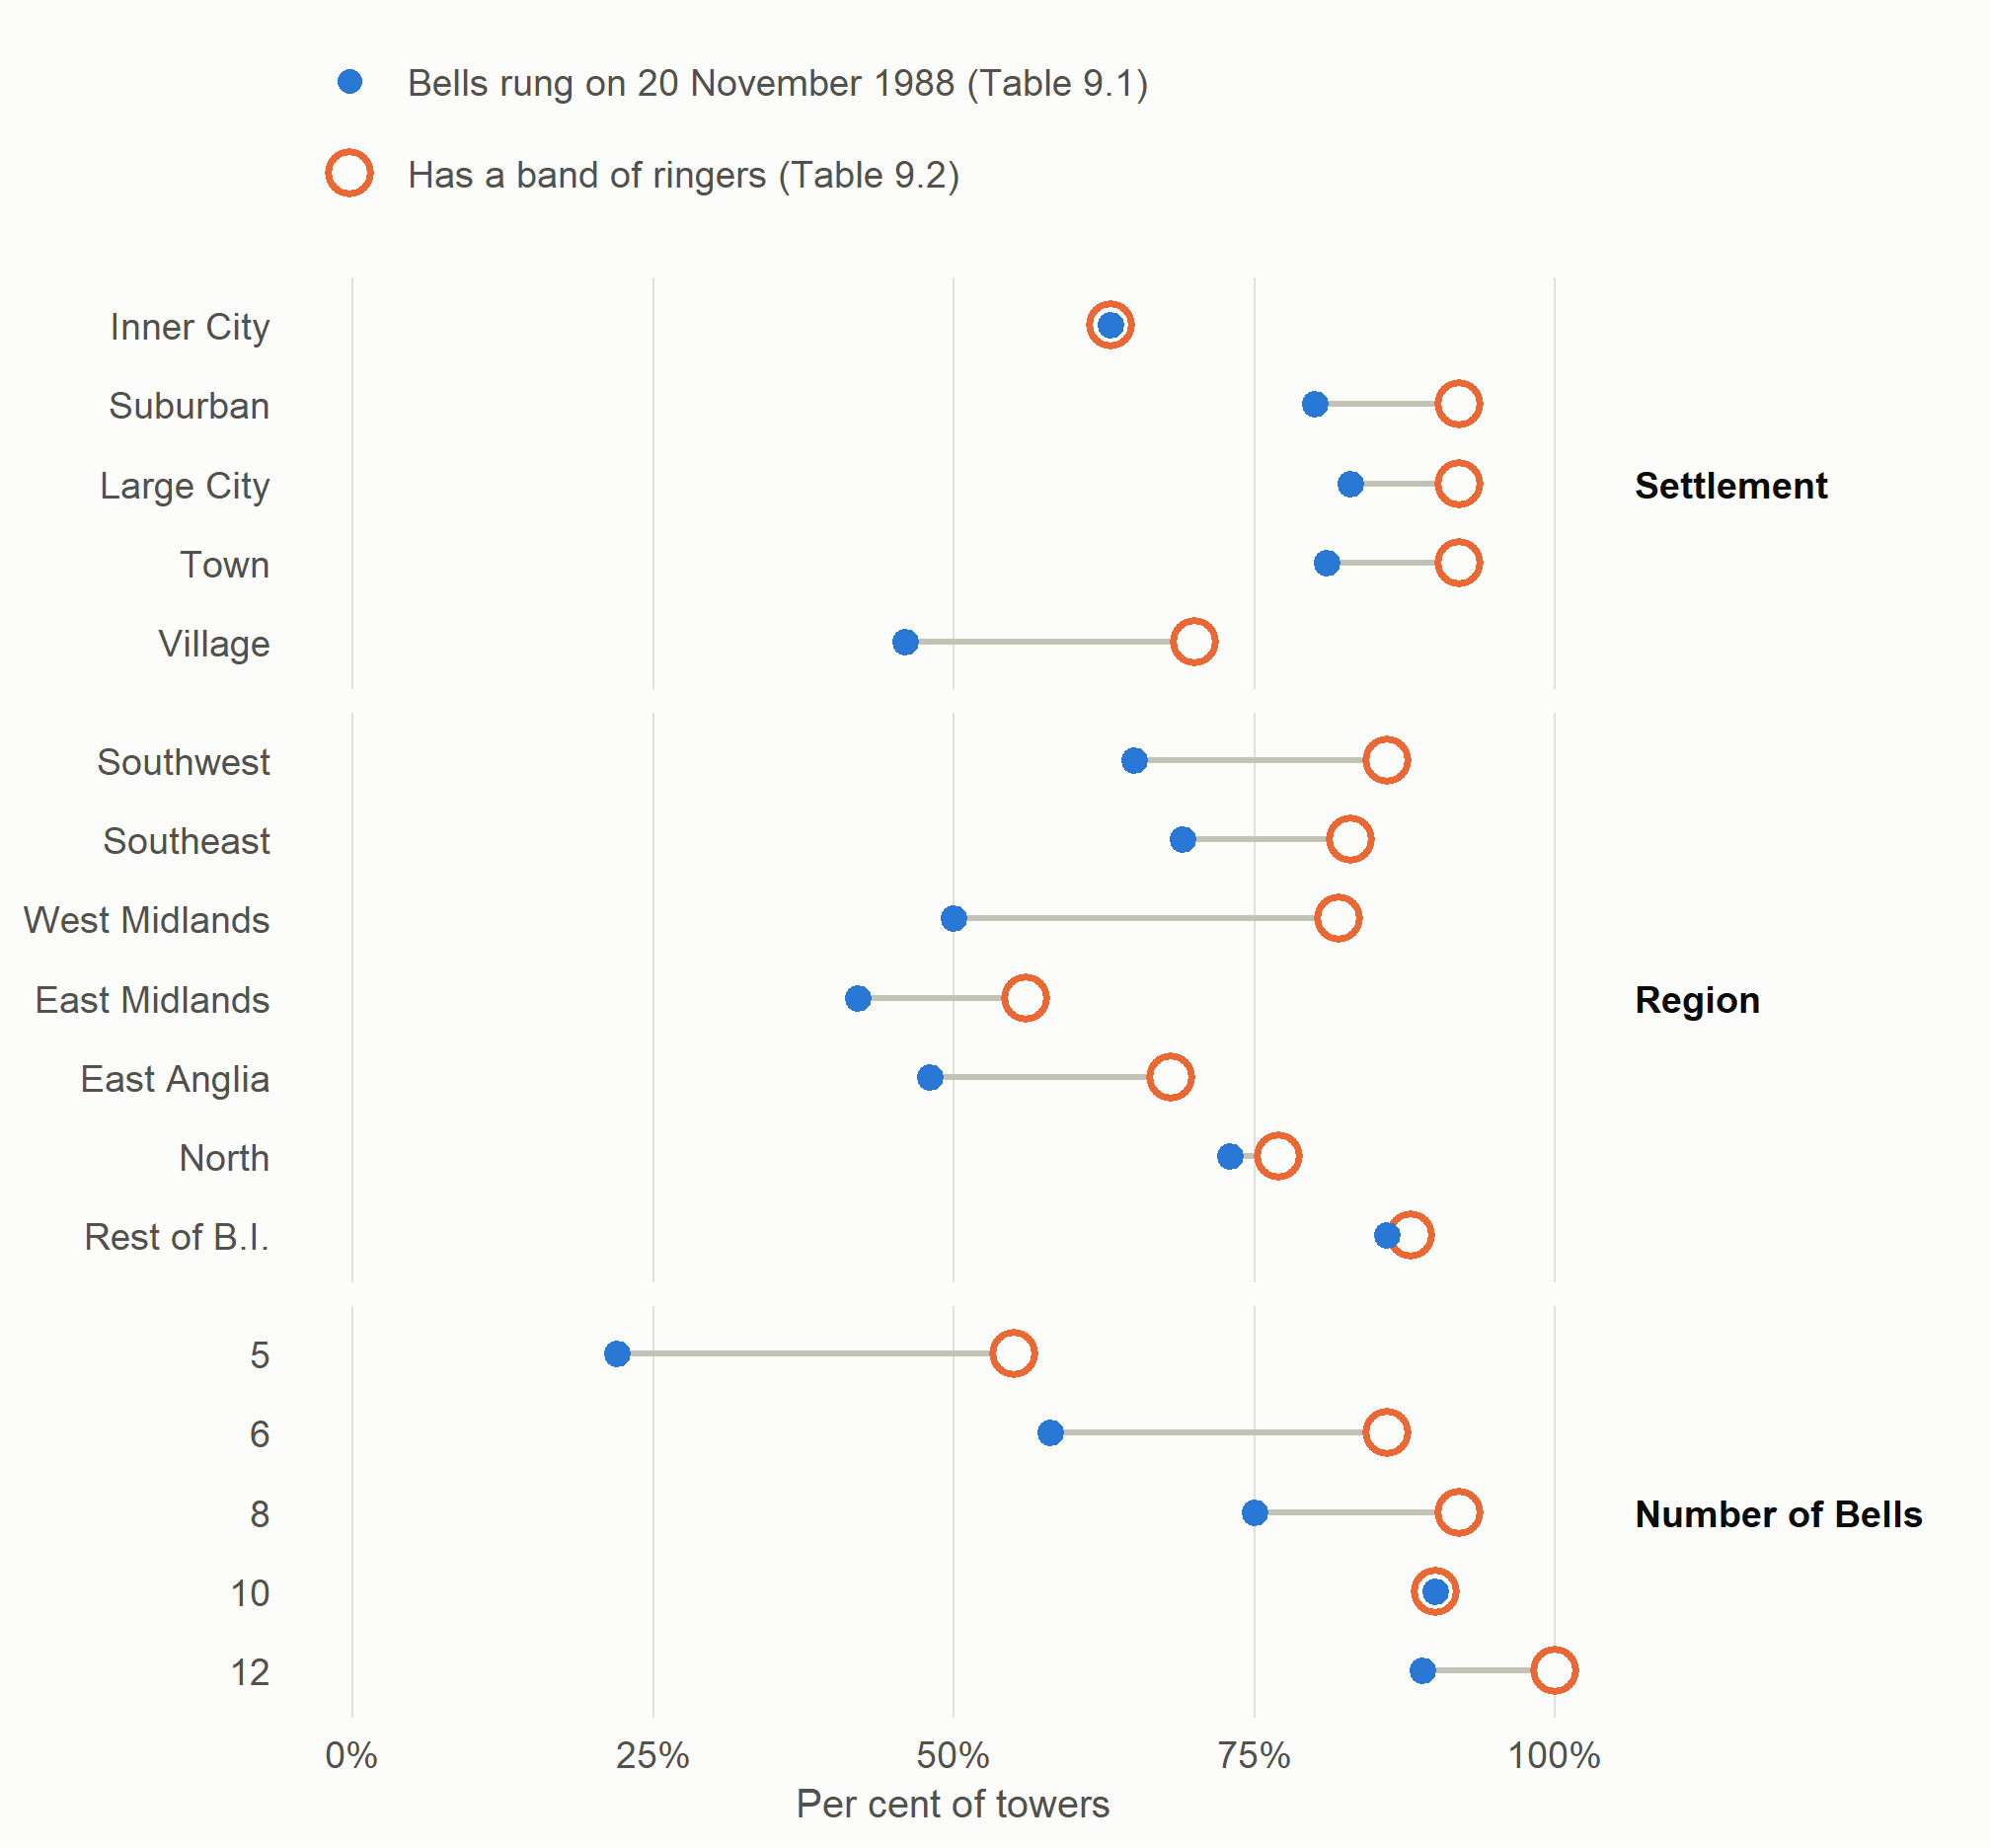
Table 9.1 shows the percentage of towers where the bells were rung on the surveyed Sunday, according to the two classifications, and also by the number of bells in the tower.
There were very significant regional differences, with the two southern regions and the North of England having many more of their rings heard than was the case in the two Midlands regions and in East Anglia. The bells were most likely to be heard in the Rest of the British Isles, however.
There were significant differences among the settlement types, too, with the inner city and village church bells much more likely to be silent. (In all of these analyses, where we use the term significant this indicates the result of a statistical test designed to show whether a difference observed in a sample is likely to be present in the population from which the sample has been drawn. Thus where significant differences are identified, these almost certainly would have been present if we had studied all 5250 towers. No details of the statistical tests are given here! For those who want to know more, contact Ron Johnston.)
“5250 towers” here. Elsewhere the report gives 5425 (Chapter 2) and 5245 (Chapters 2 and 4).
There is also a significant difference according to the number of bells in the tower; the larger the number, the greater the likelihood that the bells were rung on the Sunday in question.
Some regions and settlement types have more 5- and 6-bell towers than others, of course, so it could be that the regional and other differences identified in Table 9.1 are really just reflections of that fact. Testing for that (using what Ron Johnston calls an ANOVA design!!), we find that the regional difference disappears but that the settlement type difference remains. The smaller the number of bells in a tower, the less likely that they were rung on the Sunday in question; in addition, the bells were less likely to have been rung in villages than in other settlements, especially towns and suburbs, however many there are in the tower.
Which Towers Have a Band of Ringers?
In our second article (Chapter 3), we looked at the number of ringers at the 471 towers for which we had information. Excluding the 41 towers where either the bells were unringable or there was a special case (see The Ringing World, 10 March 1989), we can analyse 430 cases here. (As an aside, we can note that of the 31 unringable towers, one-third occur in each of two regions - Southwest England and the East Midlands; three-quarters of them are in villages.)
The second article, on the number of ringers, is Chapter 4 in this book, not Chapter 3.
Table 9.2 indicates the percentage of towers with a band, according to each of the classifications. Again, there is a substantial regional variation, with more than 80 per cent of the towers having a band in each of the two southern regions, plus the West Midlands, compared with only 56 per cent in the East Midlands and 68 per cent in East Anglia.
p. 39 The North of England scores only just below 80 per cent, but the prize goes to the Rest of the British Isles, where 21 of the 24 towers reported having a band of ringers.
There is a substantial difference between the settlement types, too. Over 90 per cent of the towers in the suburbs, in the centres of the large cities (places like Bristol, Norwich and Nottingham, which is not to imply than any one of those three is represented in the Survey), and in the towns were reported as having bands of ringers, compared to only 63 per cent of the inner city churches and 70 per cent in the villages.
Of course the villages are more likely to have rings of 5, many fewer of which have a band of ringers, than are the towns. Some regions have more rings of 5 than others, too, so are the differences for regions and settlement types in Table 9.2 really reflections of the number of bells in the tower? And if so, is the real reason for the lack of a band the small number of bells or the small population served by the parish church? The analyses show that, taking account of the number of bells in the tower, the differences between the settlement types remain, but not those between regions. Village and inner city towers are least likely to have a band of ringers, however many bells there are.
How Many Ringers?
Table 9.3 gives the average number of ringers per bell in each of the categories, for the towers which had bands of ringers. It shows that among the regions, where towers have bands they are on average healthiest in terms of members in the Southeast and the North of England and, especially, in the Rest of the British Isles. There is also a substantial difference between settlement types; the village and inner-city bands tend to be the smallest.
Band size also varies according to the number of bells in the tower, as shown in Table 9.3. Once these variations were taken into account, however, the regional and settlement type variations remained. Relative to the number of bells in the towers, bands are largest in the towns and suburbs of the British Isles and smallest in the inner cities and villages; they are larger in the Rest of the British Isles than in ‘mainland England’, while within England the healthiest situation is in the Southeast and the North.
And How Many People Rang on 20 November?
When it comes to turnout rates, we are only able to analyse the 300 towers from which we received responses from the tower captains. We found no significant patterns; approximately the same turnout levels were recorded in each region and settlement type.
What Did They Ring?
Tower captains were asked what was regularly rung at their towers on Sundays. Table 9.4 shows that the larger the number of bells the greater the percentage of towers where Stedman, Treble Bob and Surprise p. 40 are regularly rung. In addition, those methods are more likely be rung in the inner city and large city towers, and very unlikely to be rung in the villages, differences that hold even when the number of bells in the tower is allowed for. Regionally, there are fewer clear differences, but Stedman and Grandsire do seem to be more popular in the south of England than elsewhere.
Recruitment and Change
Was there any variation in the relative growth and decline of ringing, by number of bells in the tower, by region, or by settlement type? Table 9.5 provides answers derived from the tower captains, and so doesn’t refer to the towers where ringing stopped during the year and there was nobody left to answer.
Of the 300 tower captains, 201 (67 per cent) reported recruiting learners during the twelve months prior to the survey. There was a significant difference in the proportion of towers that obtained recruits only by region: 81 per cent of towers in the West Midlands and the North of England obtained recruits as did 73 per cent in the Southeast, compared to 50 per cent in East Anglia, 59 per cent in the East Midlands and 61 per cent in the Southwest; the percentage for the Rest of the British Isles was 68.
The average number of recruits per tower, over all towers in each category since we are interested in the total pattern of recruitment, is given in Table 9.5. The greater the number of bells, up to 10, the greater the number of new recruits. The city towers did better than those in the towns, suburbs and, especially, the villages. The Rest of the British Isles’ towers did much better than those in the English regions, particularly the East Midlands and East Anglia. Tower captains were also asked how many of those recruits were still ringing at the time of the Survey, and the average numbers show the same general pattern by region but a very high wastage rate for the inner city towers and for the (small number of) rings of 12. The most significant difference, according to our statistical tests, was between the regions.
We also asked how many ringers had left their band during the preceding twelve months: 111 reported the departure of people who had given up ringing altogether; East Anglian towers apparently suffered worst in that respect, and the inner city towers lost none, but overall there were no significant differences. In 44 cases, ringers were lost to other towers in the local area; there were significant differences between the settlement types in the amount of loss, with the city towers faring best. And 104 towers lost ringers who left the area altogether: the greater the number of bells, the greater the average loss, largely because the larger rings are in the larger cities which experience the greatest bellringer mobility it seems; villagers are least likely to move away. Finally, 82 of the tower captains reported that proficient ringers had joined their bands over the period. Again, the main significant difference is between the settlement types; the villages got fewest inmigrants, as might be expected, and the large p. 41 cities, though not the conurban inner cities, were the main beneficiaries - hence the larger average number for the rings of 8.
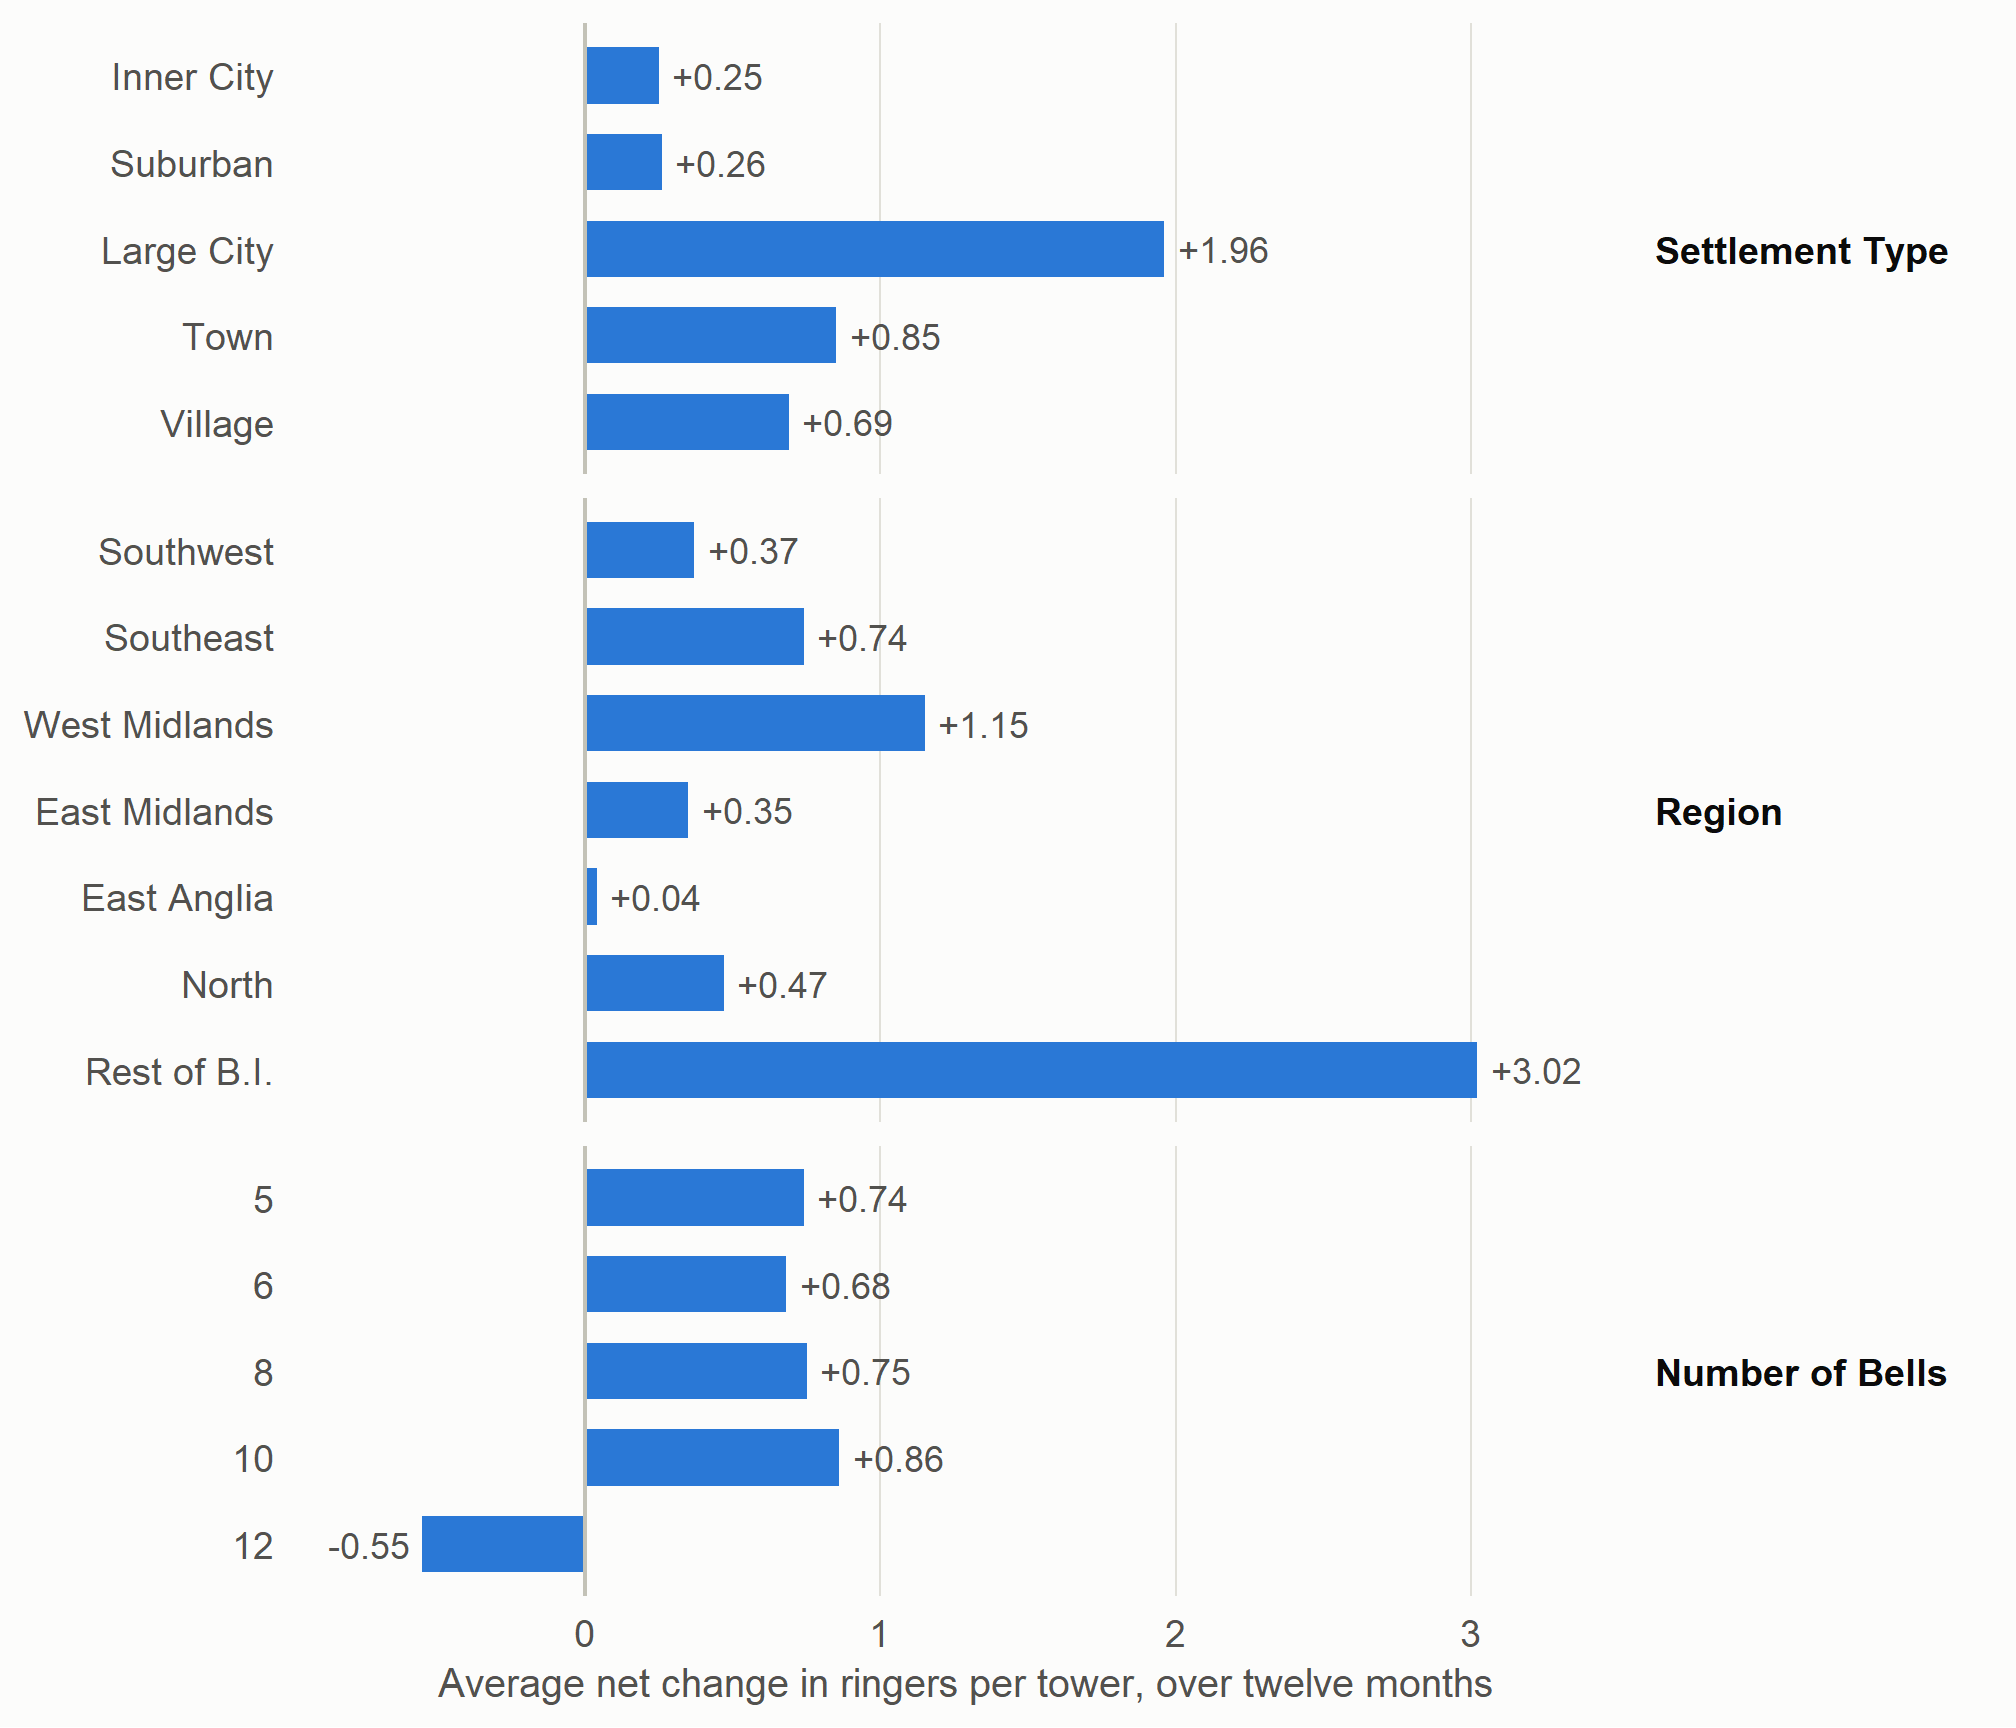
Overall, there was a net increase in the number of ringers during the year (a conclusion obtained by summing the numbers in columns 2 and 6 of Table 9.5 and subtracting from that figure the numbers in columns 3, 4, and 5) but it averaged only 0.69 ringers per tower - which is equivalent to about 3600 extra ringers for the country as a whole over the twelve-month period. As the final column of Table 9.5 shows, a net gain was reported in all of the categories except one - for 12-bell towers which suffered a net loss of ringers over the twelve-month period, largely because of the large numbers who either moved away from the area or gave up ringing. The other four types according to number of bells all experienced a net gain of between 0.68 and 0.86, or approximately two ringers for every three towers.
There were significant differences in the other two categories. By region, the Rest of the British Isles experienced by far the best net inflow, followed (at an average of just over one ringer per tower) by the West Midlands and then the Southeast. In East Anglia, the average situation was no real change in the number of ringers at all. By settlement type, the large cities and the suburbs performed worst, and the large cities the best. Overall, the situation in villages was three times better than that in the main conurbations.
As printed, this sentence names the large cities as both worst and best. Table 9.5 suggests that the suburbs and inner cities did worst and the large cities best.
So where is ringing healthiest? Not, it seems, in the country with which it is generally associated - England - but rather in Scotland, Wales and Ireland and the Channel Islands, in all of which the opportunities are much fewer. In England, it is the inner city and village churches which seem to have most problems, and regionally ringing appears to be least healthy in the eastern counties.
p. 42
Chapter 9 Tables
Tables 9.1 and 9.2 are easier to read together. Each row shows two things for one kind of tower: whether its bells rang on the census Sunday (blue) and whether it had a band (orange). The settlement types matter most for 2026: the report found that regional differences disappear once ring size is allowed for, but settlement differences remain (Chapter 9). Villages stand out, with a band at 70 per cent of towers but bells rung at only 46 per cent. The report gives its five settlement types but not the rule it used to assign towers to them. The two measures also come from different questions and bases, so read the gap between the dots as indicative, not as an exact count of silent towers with a band.
In the original each of Tables 9.1 to 9.3 sets its three classifications side by side. Here they are stacked, one row per category.
p. 43
p. 44
The Number of Bells rows report the same question as Table 5.4, and mostly agree with it. Five figures differ: for 10 bells, Rounds/Call Changes 86 here against 87 in Table 5.4, and Treble Bob 14 against 13; for 12 bells, Rounds/Call Changes 62 against 63, Grandsire 72 against 63, and Treble Bob 11 against 13. Both tables are transcribed as printed.
p. 45
The last column of Table 9.5 is the one that matters: the average net gain or loss of ringers per tower over the year. It was positive almost everywhere, small in East Anglia (0.04) and negative only at rings of twelve (-0.55). The report does not give the number of towers behind each row, and some rows are small: only 8 tower captains at twelve-bell towers replied (Table 7.1), and the inner-city percentages in Table 9.4 move in steps of 20, which suggests about five. Treat single bars with caution.